A lack of AI observability into the performance of workloads and infrastructure isn’t typically the first challenge teams consider. Managing AI clusters is notoriously difficult, from bringing them to production to resolving failures to optimizing performance. Many industry experts will point to the high rate of job failures as a key challenge in managing AI clusters.
Since the nature of AI workloads requires pushing infrastructure to the bleeding edge, job failures are inevitable. However, teams can solve how quickly they respond to them—and prevent failures from derailing your training job. This all depends on observability.
Staying ahead of job failures requires full-stack observability of all elements of your AI infrastructure and workloads. Deeper insights into what’s going on in your AI cluster don’t just benefit you when things go wrong. It also can enable optimal training times and higher resource utilization, which can lead to cost savings from greater efficiency.
Let’s discuss what’s driving the need for better visibility into your cluster performance, how to get more AI observability over your clusters, and some important metrics to track.
What’s driving job failures for AI workloads?
Before we can talk about the ‘how’ of AI observability, we need to understand the ‘why.’ There are a number of industry factors that have contributed to the increase in job failures and the need for specialized solutions that offer greater insights into infrastructure services, including:
- Increasing cluster sizes
- Rapidly-evolving infrastructure
- Isolated AI infrastructure and AI workloads
First, cluster sizes and datasets for machine learning (ML) training have ballooned over the past few years. Take a look at how ChatGPT has evolved; GPT-4 represents over a 10-fold increase from GPT-3's 175 billion parameters.

As our CTO Peter Salanki wrote for Turing Post, “As the infrastructure scales, so too do the potential points of failure if left unmanaged.” A 32K GPU cluster can have upwards of 320,000 possible points of failure and, depending on your infrastructure solution, no guaranteed visibility into each spot.
Second, the hardware and infrastructure requirements for AI have rapidly evolved over the past few years, and each change introduces potential new bugs or errors. Advanced chips and networking components are essential for tasks like training, burst compute, and inference; however, they bring additional complexity and can introduce new challenges for infrastructure management.
Working at the “bleeding edge of technology” means AI workloads constantly push systems toward the brink and beyond. In these environments, teams must prepare for job failures and interruptions. However, maintaining the infrastructure at this high level of performance is extremely difficult. This is especially true for organizations that use on-premise GPU infrastructure to train their LLMs, in which the burden of infrastructure and workload management falls entirely on their team.
Perhaps the most consequential challenge is the siloed nature of AI infrastructure and AI workload tech stacks. Traditionally, AI infrastructure (like GPUs) and AI workloads (like LLM frameworks) are managed separately. Most teams don’t operate in a single platform that gives them all the insights they need over these two entangled properties.
The consequence: Siloed environments for AI infrastructure and AI workloads create different monitoring capabilities, limitations, and expectations for who’s responsible for managing cluster health. This presents a major challenge in responding to failures, measuring performance, and gathering the insights teams need to evaluate their AI systems.
There is a clear need for broad, precise, and deeper visibility into the system health for both AI infrastructure and AI workloads. Achieving this level of AI observability requires an elite fleet management system.
Fleet management for AI: How to get better observability into your AI clusters
Fleet management for AI (or “AI fleet management”) is a robust system of human and automated tasks that monitor the lifecycle of all the components in your AI stack to ensure optimal performance. Advanced systems go beyond the node lifecycle, although that’s a central part, to help to ensure pieces like networking and storage are also working as expected. The goal is to catch and identify failures as soon as they occur, as well as identify dips in performance where a component might not be running as smoothly as it should.
You need effective fleet management to enable greater visibility and monitoring capabilities across your stack. Without it, job interruptions or failures can go undetected and unresolved. With it, enhanced visibility kicks off a wave of downstream benefits:
- Less time spent fixing infrastructure
- More time spent training models
- Higher utilization of resources
- Save costs from the added efficiency
- Faster to market with a cluster that works on day one
So what does it take to build a robust fleet management system and gain full-stack observability? The system you choose (or create) may differ depending on your needs, but it should have these four qualities.
1. A cluster validation platform
Speed to market depends on how fast a platform can bring up and deliver healthy infrastructure to clients. It’s not about “plugging” GPUs in quickly. It’s about the quality and readiness of the infrastructure—and that’s where a validation platform comes into play.
During bring-up (aka the pre-production phase), the validation platform runs all the nodes through a series of tests to prepare to join the production fleet. The tests can include firmware updates, rigorous validation testing, cable verification, and a suite of other reliability assessments.
This is best illustrated in “Day 1” of the node lifecycle process that CoreWeave follows for all our customer clusters. This process supports a consistent state of readiness and operational excellence, saving CoreWeave customers valuable time and engineering resources from dealing with preventable issues after deployment.

2. Regular health checks
At runtime, the moment that AI infrastructure is deemed “healthy” and can run a workload, teams need to continuously check the health of the nodes. This includes two types of health checks: active and passive.
- Active health checks: run during idle periods (like bring-up and verification on “Day 1”) and require using the GPU.
- Passive health checks: run in the background while Nodes are active (“Day 2” in the node lifecycle) and don’t require GPU utilization.
Both health checks collect metrics and help detect errors (like GPU failures, temperature spikes, etc.), allowing DevOps teams to quickly identify, locate, and respond to problems throughout the node lifecycle. This helps improve reliability and uptime, as measured by the length of uninterrupted training jobs and the time it takes to restart training jobs after a failure.
Health checks can and should go beyond the node. Components like networking and storage bandwidth are important to monitor regarding AI infrastructure and can impact the performance of your AI workloads.
CoreWeave GPU instances run on bare metal—not virtualized via a hyperscaler. This key differentiator allows us to increase visibility into the infrastructure and track granular metrics around node health.
3. Continuous monitoring and benchmarking
Managing cluster health doesn’t end when nodes move into production. As we alluded to in the sections above, “Day 2” of fleet operations includes all the continuous health checks and operations that go into maintaining a healthy infrastructure and environment for your AI workloads. This includes:
- Ensuring nodes remain operational within Kubernetes (or your orchestration platform)
- All the active and passive health checks
- Triaging and testing of failed or underperforming components
- An RMA (return merchandise authorization) process for broken components
What do all these monitoring capabilities lead to? More metrics for deeper performance benchmarks. It’s always good to evaluate the performance of your model and infrastructure over time. AI fleet management can provide the insights and tools you need to run benchmarks and trend analyses of your workloads.
For example, this image captures all the active health checks CoreWeave ran on our fleet of NVIDIA Tensor Core H100 GPUs. You can start to see how long-term trends help us identify areas where improvements could be made.

4. Advanced automation
Finally, effective fleet management is simply not possible at scale without advanced automation. In the case of the 32K GPU cluster, you can’t have a human watch every 320,000+ potential points of failure 24-7 and expect them to catch everything. Even with a simple layer of automated monitoring, your DevOps team is still responsible for diagnosing and solving issues when jobs fail.
Cutting-edge, “human-in-the-loop” automation is the key that helps keep your fleet management running and your infrastructure optimized. Typically built into the software layers throughout the stack, this automation enables:
- Detailed alerts to your team of a changing node condition
- Passive health checks, around the clock
- Fast debugging of more “solvable” issues
- And much more
There is still a human element to fleet management, like the RMA process. MLOps teams, or their cloud provider, should still have a team of engineers who oversee all of this and jump in when needed.
What an observability platform looks like
Robust fleet management goes a long way toward improving visibility into your AI infrastructure and workloads. However, it’s still difficult for MLOps teams today to track all the metrics they need from all their AI infrastructure and workload data in one place.
Remember that most teams don’t operate all their AI infrastructure in one place—their resources are scattered across clouds and on-premise environments. Today, teams use various tools to monitor and manage all their AI workloads and the infrastructure that powers them. This complexity makes it extremely difficult for MLOps teams to:
- gather comprehensive and deep insights
- pinpoint issues
- keep model performance in check
Nonetheless, it’s important for DevOps teams to have an observability platform or a trustworthy place where they can monitor and evaluate their AI infrastructure and workloads in tandem.
Observability platform and tools
If your AI infrastructure lives on-prem, you will likely have to create some of this yourself. Otherwise, your cloud provider should give you access to this type of information—rather than your infrastructure living in a “black box.”
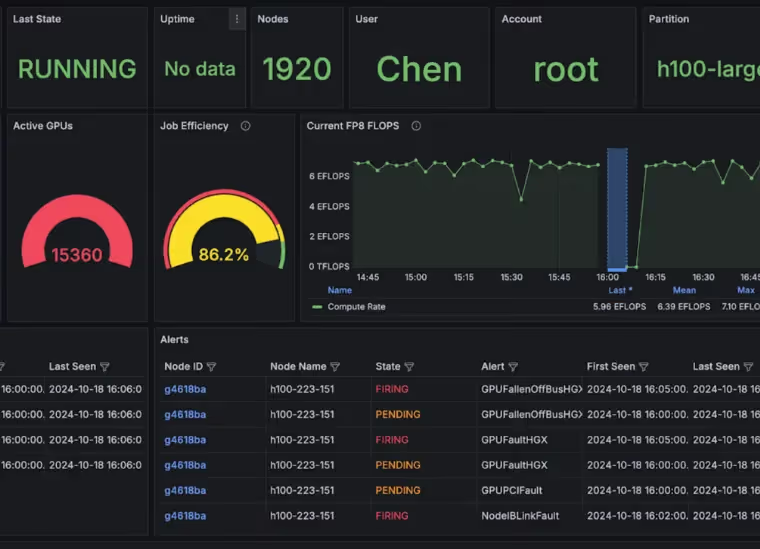
Here’s a screenshot of an observability dashboard from CoreWeave Cloud. This is only 1/5th of the full dashboard! As you can see, there are tons of metrics to track that go beyond stating the health status of your cluster.

So, how do you go about creating—or getting access to—a dashboard like this? Many metrics tracked in an observability platform come from built-in tools that live throughout your tech stack.
AI observability tools are specialized software solutions designed to monitor, analyze, and provide insights into AI systems, models, and infrastructure. They help enable fleet management of AI workloads and provide greater visibility into AI infrastructure through
- Comprehensive monitoring
- Anomaly detection
- Performance benchmarking
- Automated alerts
- Root cause analysis
- And more
By providing these capabilities, AI observability tools enable organizations to manage fleets of AI workloads more effectively, gain deeper insights into their AI infrastructure, and ultimately improve their AI systems' reliability, performance, and cost-effectiveness.
Take a look at some of the tools that CoreWeave uses to automate fleet management and gather metrics:

AI observability metrics to track
When it comes to metrics, DevOps and MLOps teams often consider model performance, such as accuracy, precision, recall, etc. However, many additional metrics help track a wide range of important information regarding AI infrastructure and workload performance. These include application and system performance, usage patterns, bugs or failures, security, and regulator issues.
Some of the most important metrics for MLOps teams include:
- CPU/GPU utilization
- Uptime/Downtime
- Memory consumption
- Latency
- Throughput
- Job completion rate
The list of all the AI infrastructure and AI workload metrics can feel exhausting. It’s important for teams to identify the core values that most impact their model performance and begin there. These values will likely be a combination of infrastructure- and workload-specific focuses, which is why it’s critical for teams to have the ability to track both.
Here’s a list of the many metrics that DevOps and MLOps teams might track:
- AI infrastructure metrics
- Server Monitoring
- CPU utilization: Measures the percentage of CPU capacity used by AI workloads
- Memory utilization: Tracks RAM usage, critical for memory-intensive AI tasks
- GPU utilization: Essential for monitoring AI/ML workload performance on specialized hardware
- Disk space utilization: Monitors storage capacity, which is important for large datasets
- Network Performance
- Bandwidth utilization: Tracks network usage, crucial for distributed AI training
- Latency: Monitors delays in data transmission, affecting real-time AI applications
- Throughput: Measures the rate at which data is processed, which is important for large-scale AI operations
- Storage
- I/O operations per second (IOPS): Measures storage system performance for data-intensive AI workloads
- Read/write speeds: Affects data processing efficiency in AI tasks
- Resource Management
- Resource forecasting: Predicts future resource needs based on AI workload trends
- Scaling efficiency: Measures how well the infrastructure scales with increasing AI workloads
- Power usage effectiveness (PUE): Measures the energy efficiency of AI infrastructure
- Uptime/downtime: Measures the availability of AI infrastructure
- Resource utilization per job: Assesses how efficiently resources are used by individual AI tasks
- Server Monitoring
- AI workload metrics
- Training Metrics
- Training time: Measures the duration of model training cycles
- Convergence rate: Tracks how quickly the model reaches optimal performance
- Model accuracy: Assesses the precision of AI model predictions
- Loss function values: Indicates model improvement over training iterations
- Inference Metrics
- Inference latency: Measures the time taken for the model to make predictions
- Throughput: Tracks the number of inferences processed per unit time
- Model performance metrics (e.g., F1 score, AUC-ROC): Evaluate model effectiveness in production
- Operational Metrics/Job Management
- Cost per training run: Tracks the financial efficiency of AI operations
- Error rates: Tracks system failures or issues affecting AI workloads1
- Mean time to recovery (MTTR): Measures how quickly issues are resolved
- Job queue length: Tracks backlog of AI tasks waiting to be processed
- Job completion rate: Measures the efficiency of workload processing
- Training Metrics
In summary
The importance of AI observability cannot be understated. However, enabling this is very challenging. The proliferation of multi-cloud strategies and a mix of on-premise and cloud mean that infrastructure and workload data are dispersed—and this trend is likely not going away anytime soon.
Not all clouds have enabled the depth of visibility or fleet management that MLOps teams want, leading many to create solutions themselves. If on-premise, you’re entirely responsible for creating the elements that enable those, too.
However, these challenges can be overcome. With robust fleet management—consisting of regular health checks, an elite validation platform, performance benchmarking, and automation—you can start to get the AI observability you need. This enables improved performance and reliability, faster speed-to-market, and less time spent managing infrastructure and workload failures.
Access cutting-edge transparency into cluster health and performance—allowing your teams to measure, monitor, and diagnose issues with greater speed and resiliency. To learn more about CoreWeave’s approach to advanced fleet management, schedule a call with our team and ask about CoreWeave Mission Control.


.avif)